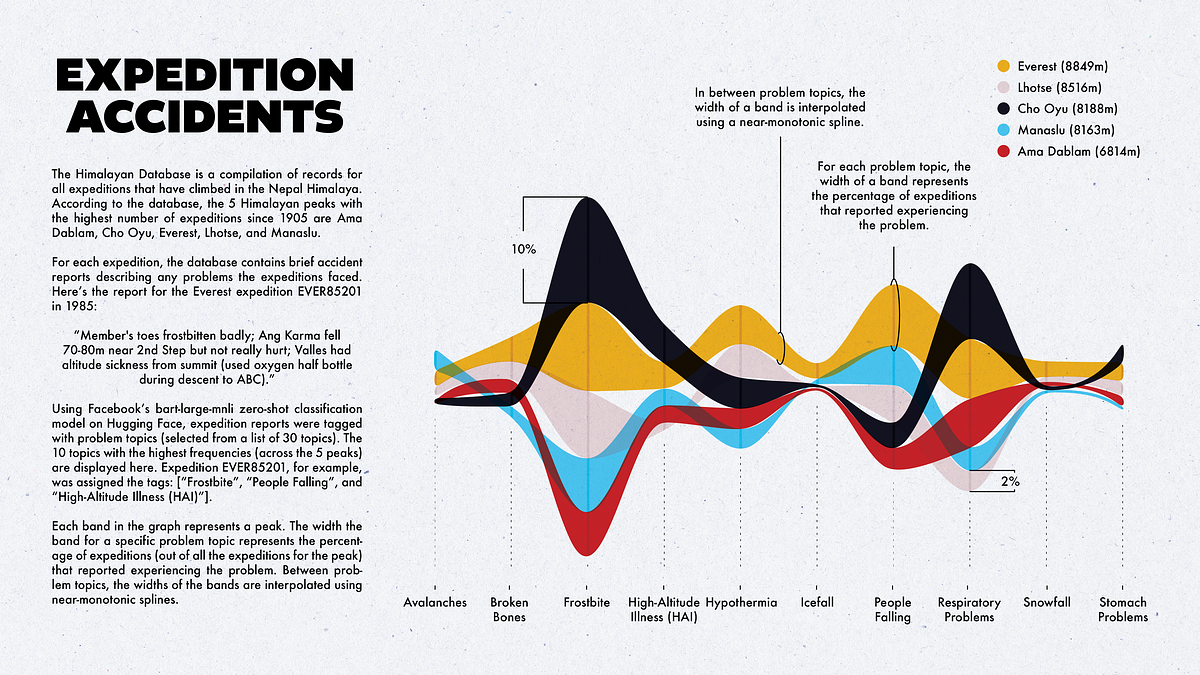
I discovered the Himalayan Database a few weeks ago and decided to create a few “whimsical” visualizations based on this dataset. In two previous articles I created a simple elevation plot for Everest expeditions and a plot showing the relative number of deaths for 5 Himalayan peaks. This time I wanted to explore expedition accident…