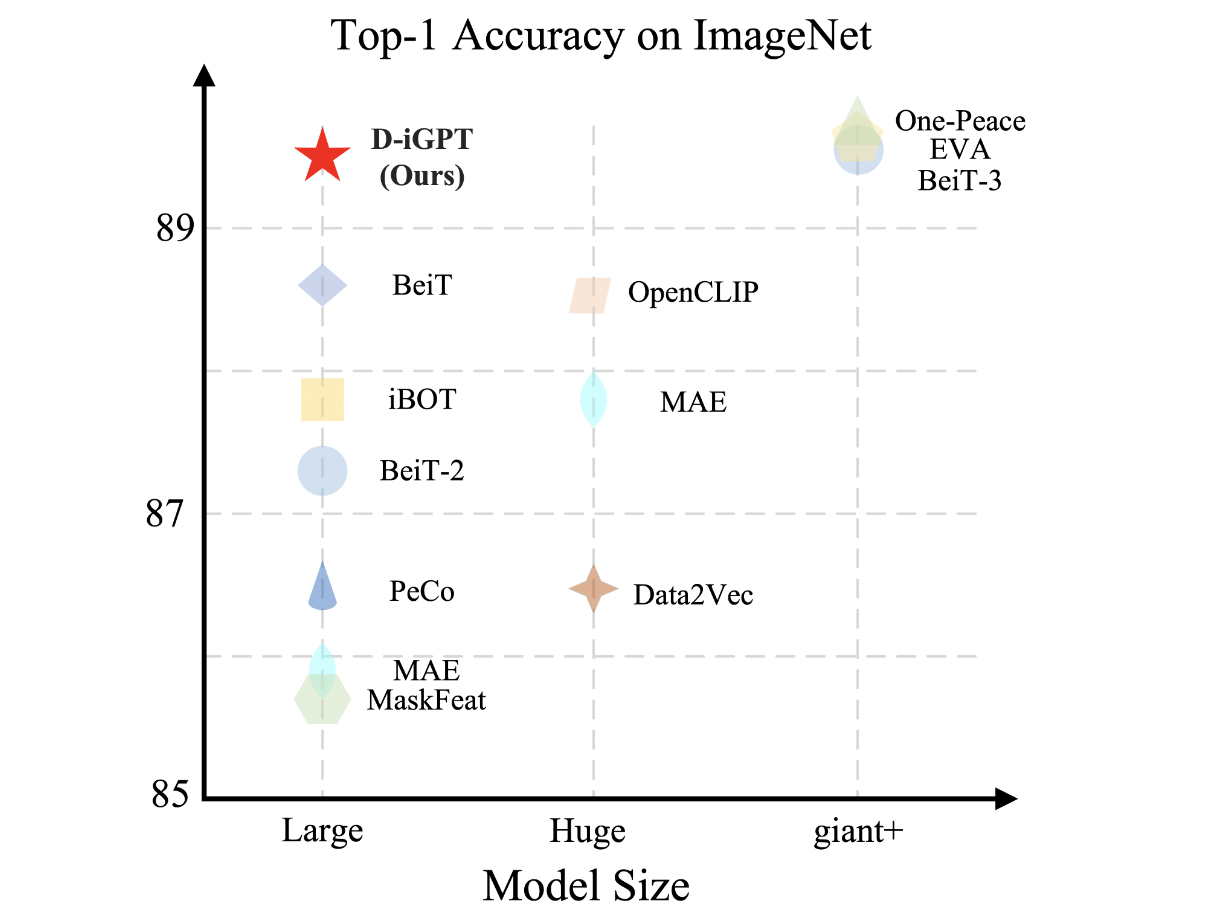
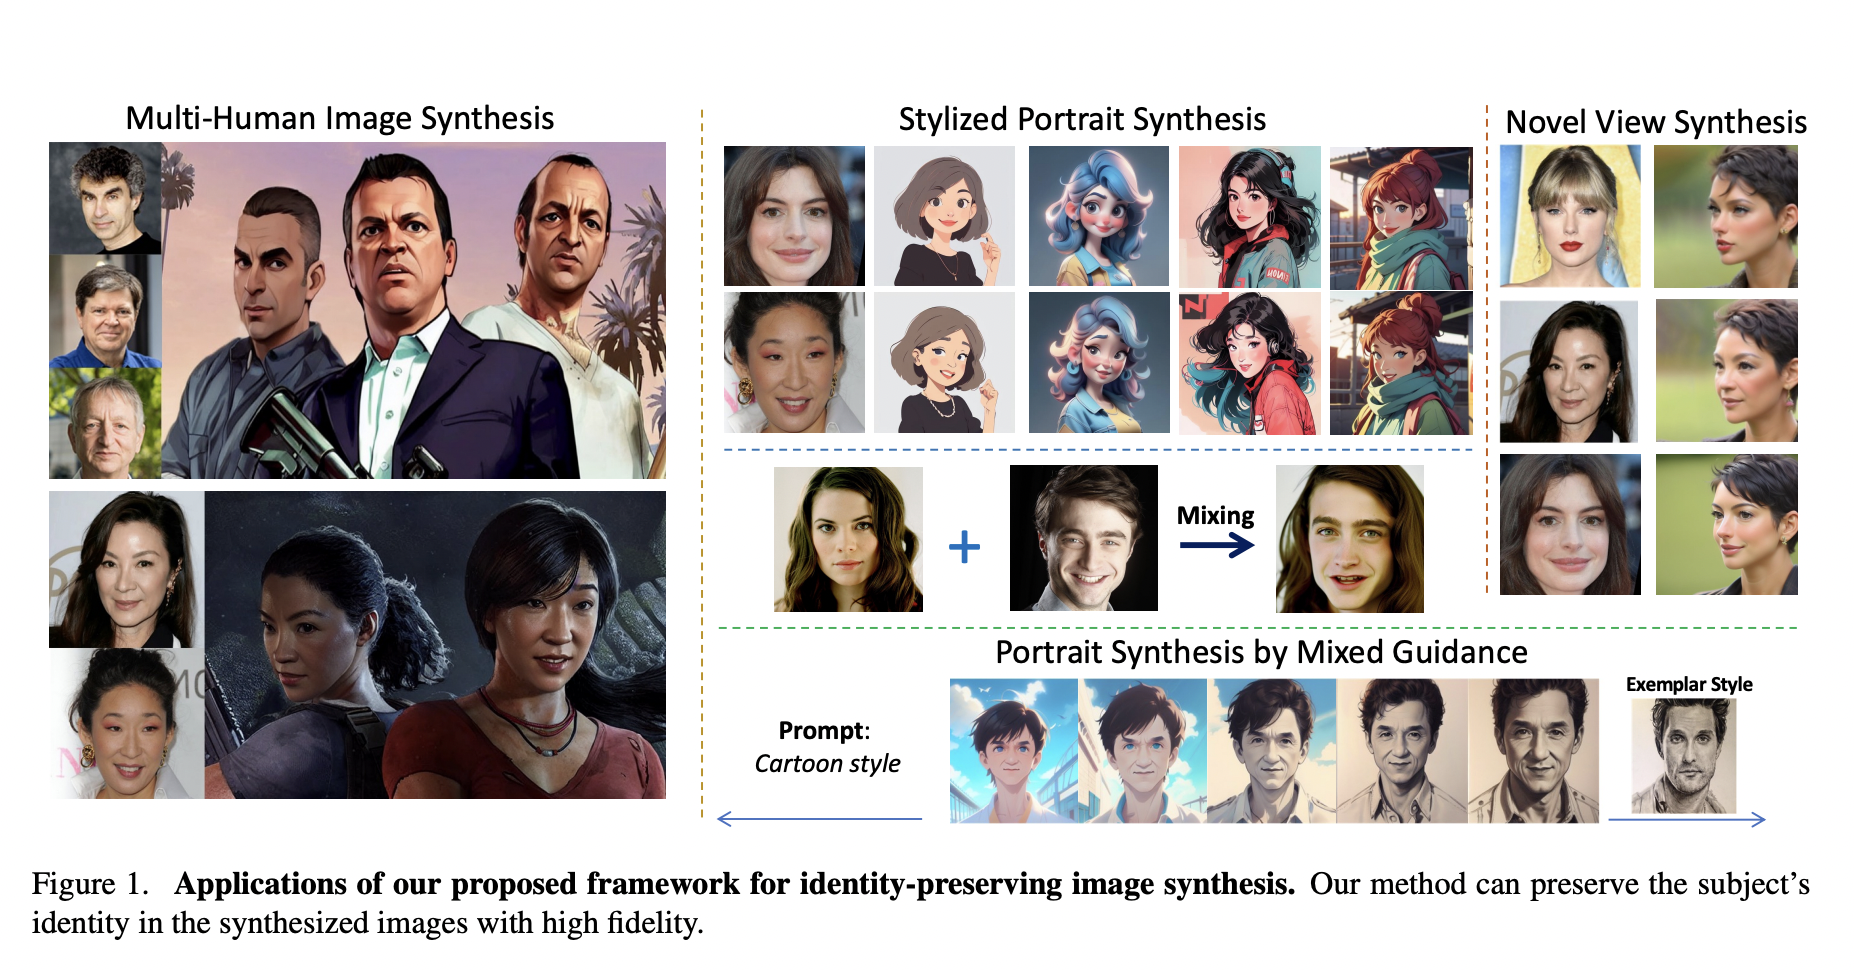
Natural language processing (NLP) has entered a transformational period with the introduction of Large Language Models (LLMs), like the GPT series, setting new performance standards for various linguistic tasks. Autoregressive pretraining, which teaches models to forecast the most likely tokens in a sequence, is one of the main factors causing this amazing achievement. Because of…


