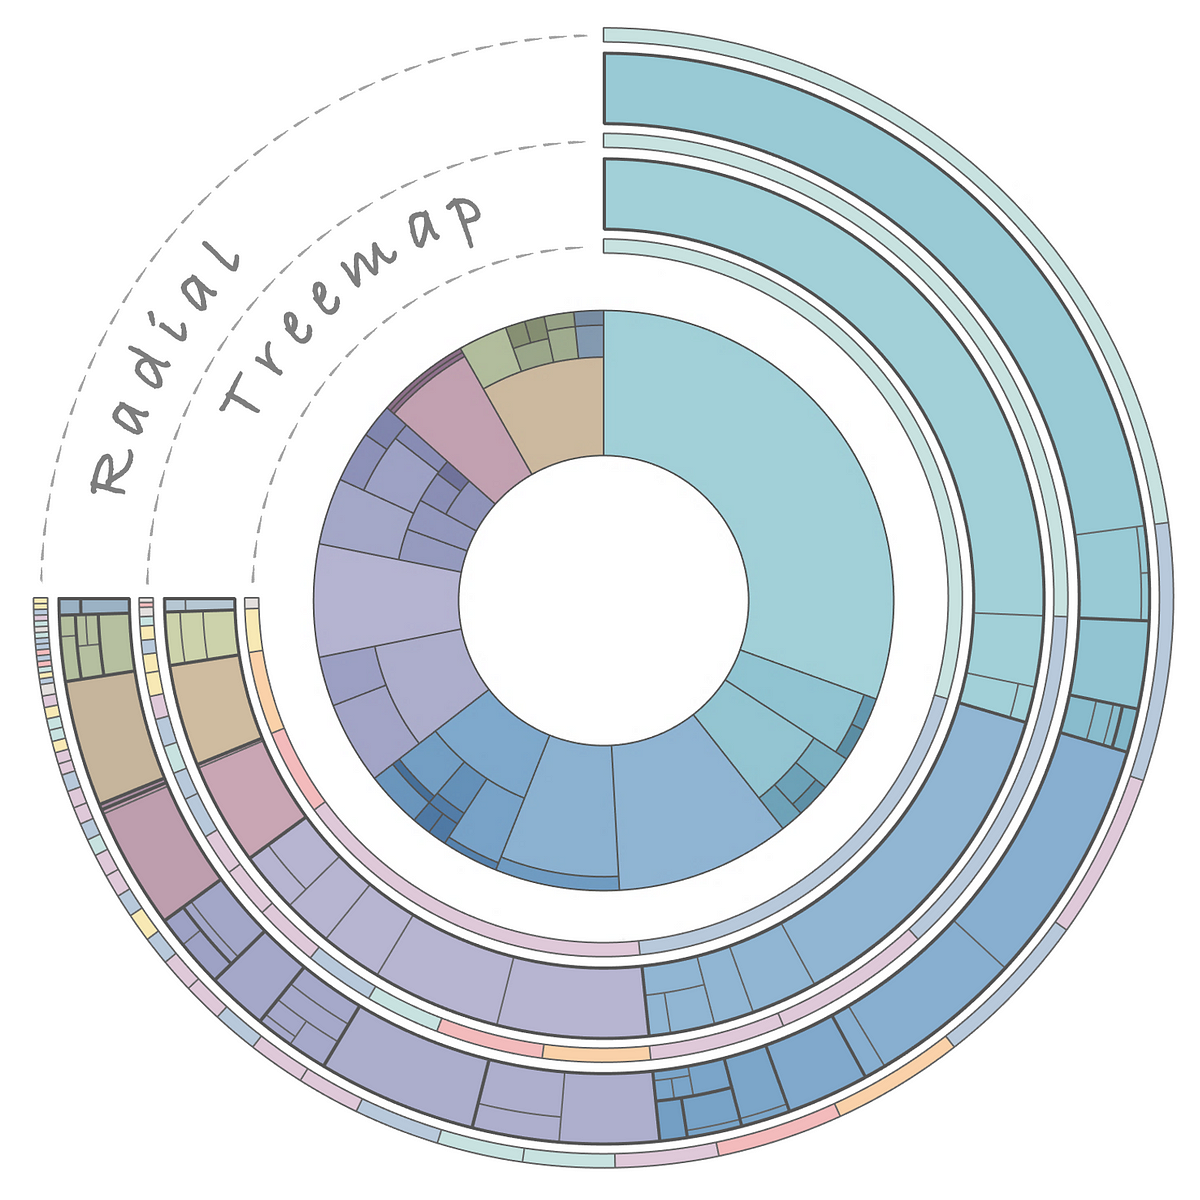
Image by Author
Data visualization isn't just about making graphs. It’s about taking data and making sense of it. And burning other peoples’ retinas with your eclectic color choices, of course.
From tracking global health trends (remember COVID-19?) to tracking your daily runs, the right chart or map can spotlight patterns and answers…


